internal:projects:cp:results
Table of Contents
Graph Results
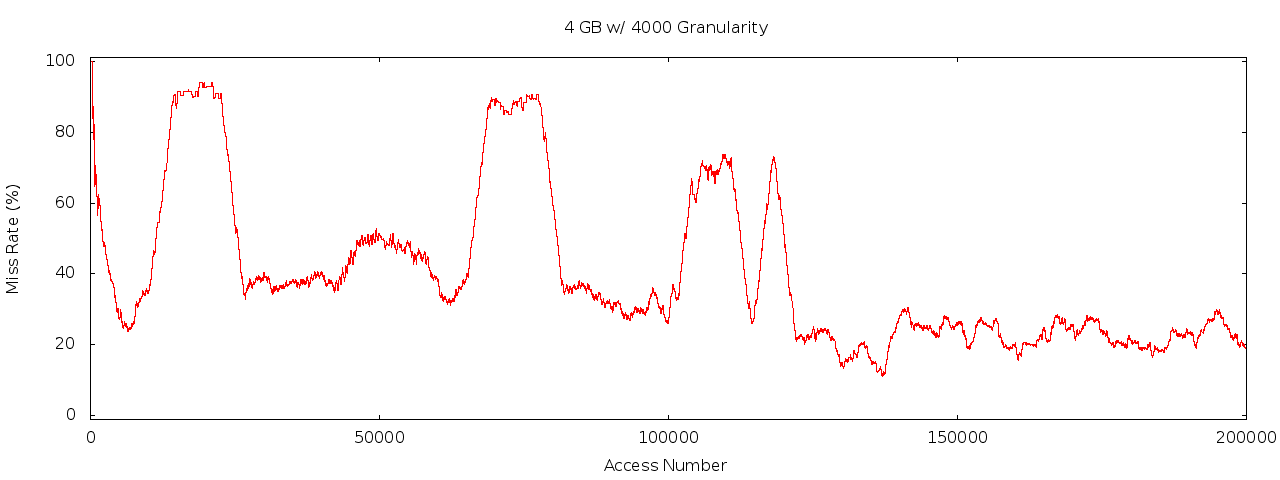
Using homes-110108-112108.1.blkparse.
Comparing Granularities and Cache Sizes
Graphs only show x-axis range from 0 to 3000 for the 10 granularity results to be visible and for comparison between different granularities.
Comparing Cache Sizes At 1000 Granularity
internal/projects/cp/results.txt · Last modified: by 127.0.0.1


