Table of Contents
SSD Caching v.s. Tiering
Participants
- Wendy Belluomini
- Joseph Glider
- Ajay Gulati
- Bindu Pucha
Project Goals
Find out best way to use SSDs as a front-end tier by designing a solution that considers device specific characteristics and using a combination of caching and tiering techniques. There are quite a few unknowns in designing such a solution which we are trying to explore.
Meetings
We are meeting every Thursday at 3pm PST (6pm PST), via 888-426-6840 (Participant Code: 45536712).
- 09/06/12: More tree updates and plans for workload simulation
- 09/04/12: Tree update and simulating workloads at tree decision points
- 08/28/12: More refining of decision tree
- 08/24/12: Refining decision tree
- 08/08/12: Paper message possibility: Cache-Tier Decision Tree
- 08/02/12: List of observations and conclusions
- 07/24/12: FAST paper message
- 06/21/12: Thesis chapter feedback
- 03/09/11: Reviewing writing, Plans for new experiments, and load-balance/sequentiality discussion
- 02/25/11: Data analysis, talking points, and writing plans
- 02/21/11: HotStorage submission plans
Latest Updates
MSR Workloads 2 Hour Runs
In this set of experiments I look at the two claims:
- First, for a more fair comparison I feed both algorithms extent statistics. To get this statistics, I simulate that a run of the complete week long trace. For EDT, I use these gather statistics to derive an initial extent placement. For MQ, I the statistics collected represent the LRU queues and ghost buffer data, which will determine the cache lines that will be initially in the cache.
- New hardware is performing much better (in particular) the SSDs in comparison with the previously used HW (EDT paper). More concretely, I'll be running the same workload with two different HW settings:
IBM
| Type | Model | Avail | Cost |
| SSD | Intel x25 MLC | 2 | $430 |
| SAS | ST3450857SS | 4 | $325 |
| SATA | ST31000340NS | 4 | $170 |
*Cost according to FAST paper per device
FIU
| Type | Model | Avail | Cost |
| SSD | Intel 320 Series MLC | 2 | $220 |
| SAS | ST3300657SS | 4 | $220 |
| SATA | ST31000524NS | 4 | $110 |
*Cost according to Google per device
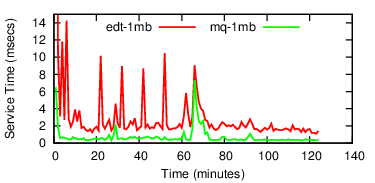
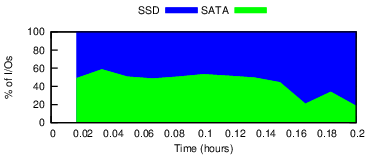
Server peak (hours 2-4 of the trace)
For this experiment I use a SSD+SATA configuration.
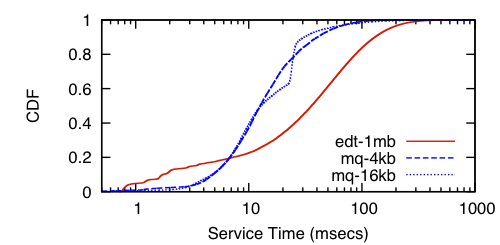
Response time
I/O distribution
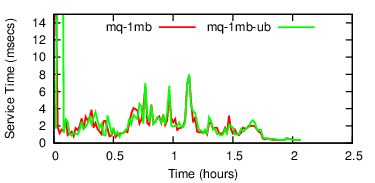
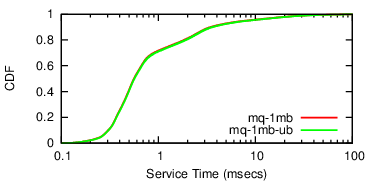
Source Control peak (hours 2-4 of the trace)
For this experiment I use a SSD+SATA configuration.
Response time
I/O distribution
Complete MSR peak (hours 8-10 of the trace)
For this experiment I use a SSD+SAS+SATA configuration.
Response time
I/O distribution
Workload Analysis
All data and plots shown below are assuming 1mb extents (cache lines).
Workload Summary
| Workload | Length (days) | Total I/Os | Active Exts | Total Exts | % Exts Accessed |
| server | 7 | 219828231 | 522919 | 1690624 | 30.930 |
| data | 7 | 125587968 | 2368184 | 3809280 | 62.168 |
| srccntl | 7 | 88442081 | 311331 | 925696 | 33.632 |
| fiu-nas | 12 | 1316154000 | 9849142 | 20507840 | 48.026 |
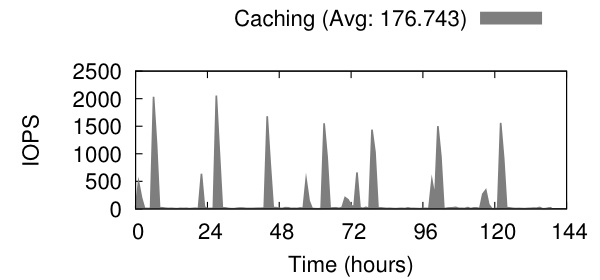
IOPS
I/O Distribution across extents
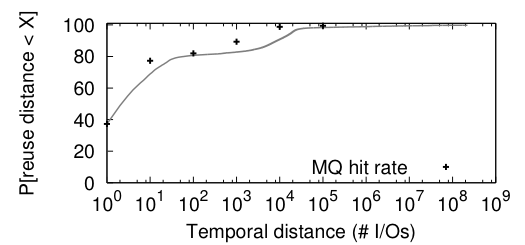
Extent reuse distance
Expected Hit Ratio
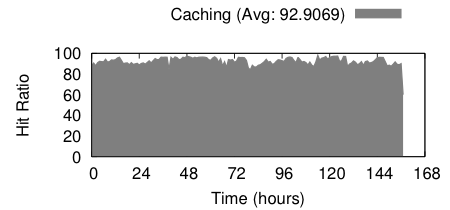
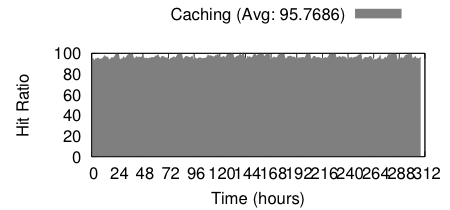
Hit Ratio
Hit rate assuming 5% and 1% of HDD space provisioning for the SSD cache.
SERVER
DATA
SRCCNTL
FIU NAS
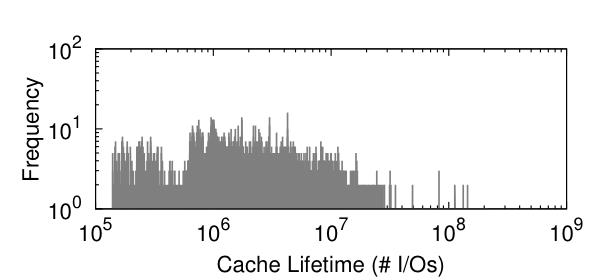
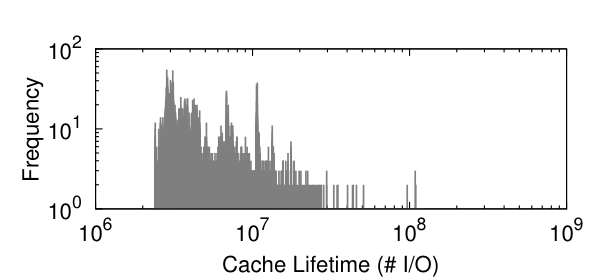
Cache Lifetime
Project TODOs
Tiering and Caching Scenarios
For all experiments there are a couple of different configurations being tried out:
- edt: EDT using extents of 1MB reconfiguring every 30min, also notice that there is throttling detection/correction going on in the background.
- mq: MQ caching algorithm (configured as in the paper) with cache lines of varying size. The cache is populated on a miss in a synchronous way. If a read I/O is received, a read for the whole line is issued to the disk, once the read completes the I/O that triggered the miss is serviced from memory and we proceed to the populate the cache. If a write I/O received, there are two options of if the I/O is smaller than the cache line, the remaining piece of the line is read from disk merged with the I/O, and the write of the merged cache line completes asynchronously. If the I/O is bigger or equal to in size to the cache line the cache is simply written to the cache as is.
- hybrid: same as mq, but added the “load balancing” algorithm proposed by Ajay.
RAND READ
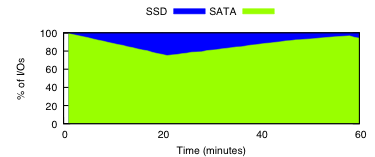
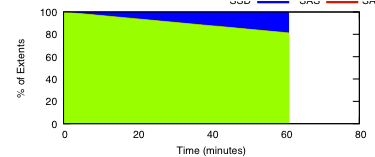
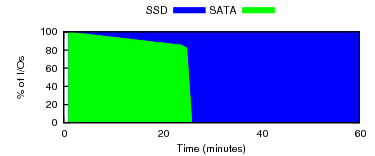
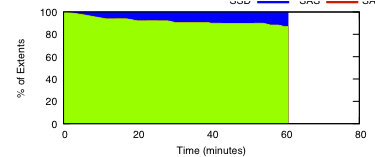
I/O and extent distribution through time (top plot is I/O and bottom is extent)
EDT
MQ
First column is 16kb cache lines and second column is 4kb.
RAND WRITE
I/O and extent distribution through time (top plot is I/O and bottom is extent)
EDT
MQ
First column is 16kb cache lines and second column is 4kb.
SEQ READ
Sequentially read 15GB from a 60GB file, in a loop for 1hr.
I/O and extent distribution through time (top plot is I/O and bottom is extent)
EDT
SEQ WRITE
Sequentially write 15GB from a 60GB file, in a loop for 1hr.
I/O and extent distribution through time (top plot is I/O and bottom is extent)
EDT
Study related work on SSD caching
In particular the paper from Reddy's group. We should also look at Ismail Ari's work from HP labs. IIRC, he brought up this issue of modeling the cost of writes explicitly many years ago.
Explore different caching policies (algorithms)
Such as LRU, ARC, MQ. And measure how they perform. Here we should evaluate these algorithms as it is. Then we can modify them to not write every block to SSDs but only when we think it should go in. This will include modeling the cost of writes and not doing them for every miss.
Current Status
Currently I plan to evaluate two caching solutions. First, LRU which represents a basic solution in which every page accessed is always brought to the cache if not already present. Second, a more complex approach, MQ, which was designed for storage and takes into account for frequency and recency.
Try out different caching unit
Current experiments are done using a 1mb extent, try with different sizes and measure it's impact on performance. Here we want to try out basic caching style with no prefetching and compare that with prefetching larger block size on a miss and write that to SSD. I agree with Jody that 1 MB may be an overkill. We should also consider SSD erase block size here.
Current Status
2 Tiers (SSD+SATA)
Look into provisioning cache systems.
One possibility is use a trace to provision, just like in the EDT work, but now use the requirements of the optimal placement as the result of the provisioning.
To my knowledge, include a few google searches, there is not much work on how to provision cache systems. But the general feeling is the bigger the cache the most benefit one should get, at an increase in cost.
First approach
Compute the working set size for some interval with a given “adequate” cache line size. Then take the maximum working set size across time as the size of the cache. The key questions here are:
- How long does my interval need to be? In general, the larger the interval the bigger the working set, as one expects more data to be accessed within a longer period of time. On the other side, one would want the system to perform well during peak I/O load periods, since cache misses here will likely be more costly to the increased load. Therefore, we may need to use the length of the peaks in I/O load to determine the “adequate” interval length.
- What is the adequate cache line size? Common sense seems to point to smaller cache lines as more effective. However, I think the experiments might provide some clues into which size is better.
Investigate load balancing with caching
The work from Reddy's group describes an method to load balance the I/O load in a two tier system by continuously migrating among devices in an effort to improve performance based on I/O parallelism. In particular they migrate data on three scenerios:
- Cold data is migrated, in the background, from faster device to larger devices to make room on the smaller, faster devices.
- Hot data is migrated to lighter-loaded devices, in the background, to even out performance of the devices.
- Data is migrated on writes, when writes are targeted to the heavier-loaded device and the memory cache has all the blocks of the extent to which the write blocks belong.
Get more insights into the workload characteristics
This is very useful and needed. It will be good if we can do some of the above mentioned analysis in a simulator using different workloads and then implement the near-final design in a real system. This is just my suggestion, feel free to go with the implementation route if possible.
MSR Workloads
Data plots from individual MSR volumes msr-volumes.zip.
Issue of write-through vs. write-back
Here I think write-through is pretty much necessary for cases when SSDs are local to the server and a host failure can lead to potential data loss. If the SSDs are on the array and/or are mirrored in some way, we can use write-back. I think for the first cut, we can stick to write-through.
Current Status
Current system is designed to be write-back. The write-through mechanism needs to be coded, it will require some work probably a couple of days of coding.
What is the adequate number of tiers
Are two tiers (SSD+SATA) enough, or do we need three tiers (SSD+SAS+SATA). If three tiers are need then how do we design a caching solution?
Minor Issues
Correct units on plots.- Get plots with extent placement, and random vs sequential IOPS.
Get heatmap of I/O activity through time.
